Creating Accurate Venn Diagrams in Excel, Part 1
This post (and the next) are about creating accurate Venn diagrams using Excel charts. If you are interested in this, you may be interested in my book Data Analysis Using SQL and Excel.
Recently, I had occasion to analyze prescriber data for a project at a pharmaceutical company. On of the things we wanted to do was to compare visually the prescribing habits of psychiatrists, by places them into three groups: those who only prescribe drug A; those who only prescriber drug B; and those who prescribe both. The resulting chart is:

This chart is an example of a Venn diagram. Unfortunately, Excel does not have a built-in Venn diagram creator. And, if you do a google search, you will get many examples, where the circles are placed manually. Perhaps it is my background in data analysis, but I often prefer accuracy to laziness. So, I developed a method to create simple but accurate Venn diagrams in Excel.
Creating such diagrams is, fundamentally, rather simple. However, there is some math involved. To simplify the math, this post first describes how to create a Venn diagram where the two shapes are squares. In the next post, I'll extend the ideas to using circles.
Creating a Venn diagram requires understanding the following:
Creating a Shape in Excel
How does one create a shape using Excel charts. The simple answer here is using the scatter plot. If we want to make a square, we can simply plot the four corners of the square and connect them using lines, as in the following example:
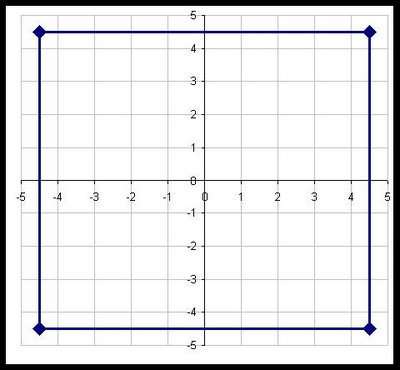
Here the square has an area of 81, so each side is exactly nine units long. It is created using five data points:
Notice that the first point is repeated twice. Otherwise, there would be four points, but only three sides.
A small challenge in doing this is making the chart look like a square instead of a rectangle. Unfortunately, Excel does not make it easy to adjust the size of a chart, say by right clicking and just entering the width and height.
One way to make the chart square is to place it in a single cell and then adjust the row height and column height to be equal. My prefered method is just to eye-ball it. The above chart has a width of six columns and a height of 21 rows.
In this case, the square is centered on the origin. There is a reason for this. The temptation is to have the square be positioned at the origin and then pass through the points (0,9), (9,9), and (9,0). However, I find that when Excel draws the square, the axes interfere with the sides of the square, so some are shaded heavier than others. This happens even when I remove the axes.
As an aside here, you can imagine creating many different types of shapes in Excel besides squares. However, Excel only understands these as lines connecting a scatter plot. In particular, this means that you cannot color the interior of the shape.
Calculating the Overlaps
Assume that we have two squares that overlap, one square has an area of 100 (side is 10) and the other 25 (side is 5). What is the overlap between them?
There is not enough information to answer this question. It is clearly between 0 (if the squares do not overlap) and 25 (the size of the smaller square). If the overlap is 10, how big is the overlap? In the following picture, the area of C is 10.

What are the dimensions of C? The height is the height of the smaller square -- 5. So the width must be 2 (=10/5).
Putting It Together
To put this together for a Venn diagram using squares, we simply need to position two squares given the following information:
The first thing to calculate is the side length for the two squares:
The second square is centered vertically, so its Y-offset is also - side/2. The X-offset is the bigger challenge. In order to get the correct overlap, it is:
The points are listed under "big square" and "little square". The first column is the X value for the big square, the second is the Y value; the third is the X value for the little square and the fourth is the Y value.
After creating the chart, you need to beautify it. I remove the axes and axis' labels, thicken the lines around the squares, and adjust the height and width to make the shape look like a square.
The attached .xls file (venn-20081025.xls) contains all the examples in this post.
The next post extends these ideas to creating Venn diagrams with circles, which are the more typical shape for them. It also shows one way to put some color in the shapes to highlight the different regions.
Recently, I had occasion to analyze prescriber data for a project at a pharmaceutical company. On of the things we wanted to do was to compare visually the prescribing habits of psychiatrists, by places them into three groups: those who only prescribe drug A; those who only prescriber drug B; and those who prescribe both. The resulting chart is:

This chart is an example of a Venn diagram. Unfortunately, Excel does not have a built-in Venn diagram creator. And, if you do a google search, you will get many examples, where the circles are placed manually. Perhaps it is my background in data analysis, but I often prefer accuracy to laziness. So, I developed a method to create simple but accurate Venn diagrams in Excel.
Creating such diagrams is, fundamentally, rather simple. However, there is some math involved. To simplify the math, this post first describes how to create a Venn diagram where the two shapes are squares. In the next post, I'll extend the ideas to using circles.
Creating a Venn diagram requires understanding the following:
- Creating shapes in Excel.
- Calculating the correct overlap of the shapes.
- Putting it all together.
Creating a Shape in Excel
How does one create a shape using Excel charts. The simple answer here is using the scatter plot. If we want to make a square, we can simply plot the four corners of the square and connect them using lines, as in the following example:

Here the square has an area of 81, so each side is exactly nine units long. It is created using five data points:
| X-Value | Y-Value | |
| -4.50 | -4.50 | |
| -4.50 | 4.50 | |
| 4.50 | 4.50 | |
| 4.50 | -4.50 | |
| -4.50 | -4.50 |
Notice that the first point is repeated twice. Otherwise, there would be four points, but only three sides.
A small challenge in doing this is making the chart look like a square instead of a rectangle. Unfortunately, Excel does not make it easy to adjust the size of a chart, say by right clicking and just entering the width and height.
One way to make the chart square is to place it in a single cell and then adjust the row height and column height to be equal. My prefered method is just to eye-ball it. The above chart has a width of six columns and a height of 21 rows.
In this case, the square is centered on the origin. There is a reason for this. The temptation is to have the square be positioned at the origin and then pass through the points (0,9), (9,9), and (9,0). However, I find that when Excel draws the square, the axes interfere with the sides of the square, so some are shaded heavier than others. This happens even when I remove the axes.
As an aside here, you can imagine creating many different types of shapes in Excel besides squares. However, Excel only understands these as lines connecting a scatter plot. In particular, this means that you cannot color the interior of the shape.
Calculating the Overlaps
Assume that we have two squares that overlap, one square has an area of 100 (side is 10) and the other 25 (side is 5). What is the overlap between them?
There is not enough information to answer this question. It is clearly between 0 (if the squares do not overlap) and 25 (the size of the smaller square). If the overlap is 10, how big is the overlap? In the following picture, the area of C is 10.

What are the dimensions of C? The height is the height of the smaller square -- 5. So the width must be 2 (=10/5).
Putting It Together
To put this together for a Venn diagram using squares, we simply need to position two squares given the following information:
- The sizes of the two squares.
- The overlap between them.
The first thing to calculate is the side length for the two squares:
- 118.07 for the first square (=sqrt(13,941)).
- 105.71 for the second (=sqrt(11,175)).
- 92.54 = 9,783 / 105.71
- (0 + X-offset, 0 + Y-offset)
- (side + X-offset, 0 + Y-offset)
- (side + X-offset, side + Y-offset)
- (0 + X-offset, side + Y-offset)
- (0 + X-offset, 0 + Y-offset)
The second square is centered vertically, so its Y-offset is also - side/2. The X-offset is the bigger challenge. In order to get the correct overlap, it is:
- (side-first - X-offset-first) - overlap-width
| Area | Side | X Offset | Y Offset | ||
| Left | 13,941 | 118.07 | -59.04 | -59.04 | |
| Right | 11,175 | 105.71 | -33.51 | 52.86 | |
| Overlap | 9,783 | 92.54 | |||
| big square | little square | ||||
| -59.04 | -59.04 | 72.20 | 52.86 | ||
| -59.04 | 59.04 | -33.51 | 52.86 | ||
| 59.04 | 59.04 | -33.51 | -52.86 | ||
| 59.04 | -59.04 | 72.20 | -52.86 | ||
| -59.04 | -59.04 | 72.20 | 52.86 | ||
The points are listed under "big square" and "little square". The first column is the X value for the big square, the second is the Y value; the third is the X value for the little square and the fourth is the Y value.
After creating the chart, you need to beautify it. I remove the axes and axis' labels, thicken the lines around the squares, and adjust the height and width to make the shape look like a square.
The attached .xls file (venn-20081025.xls) contains all the examples in this post.
The next post extends these ideas to creating Venn diagrams with circles, which are the more typical shape for them. It also shows one way to put some color in the shapes to highlight the different regions.
posted by Gordon S. Linoff at
5:25 PM
![]()

0 Comments:
Post a Comment
Links to this post:
Create a Link
<< Home